Last updated - March 16, 2026
The Ace Debugging tool is an AI-powered debugging assistant built into the Voyage coding platform. It helps students identify and fix issues in their code through structured hints, visual code highlights, and explanations of coding concepts. Instead of providing answers, Ace guides students through the debugging process so they can understand and solve problems independently.
Turning on Ace Debugger for your section
-
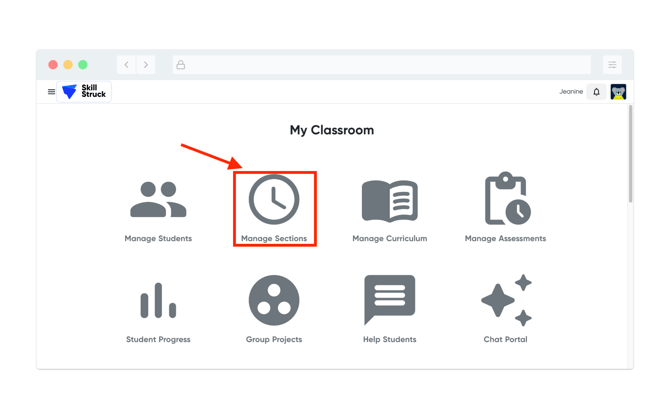
From your Educator Portal, select Manage Sections.
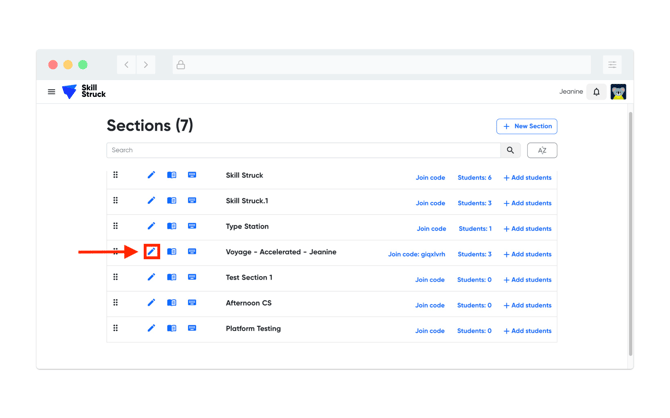
- From your section list, locate the section and click the pencil icon to edit settings.
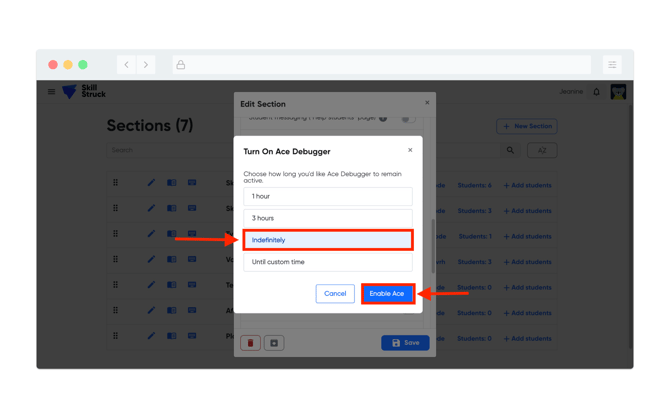
- From the Edit Section page, scroll down to the "Allow students to use Ace Debugger" setting, toggle it on by sliding the toggle to the right.
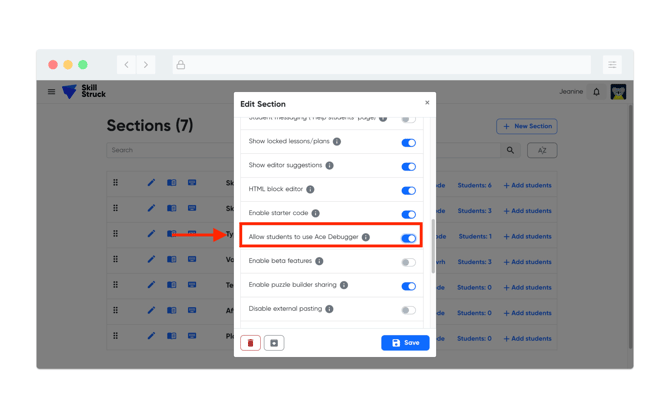
- After toggling on Ace, this will prompt you to choose how long the Ace Debugger tool will remain active. After making a selection click Enable Ace.
- After Enabling Ace, click Save on the Edit Section page.
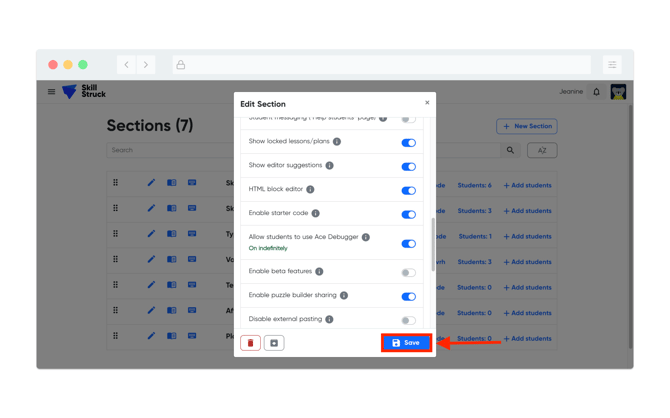
- The Ace Debugger tool is now active for your section.
How it works/looks on the student end
-
Students will need to run their code first.
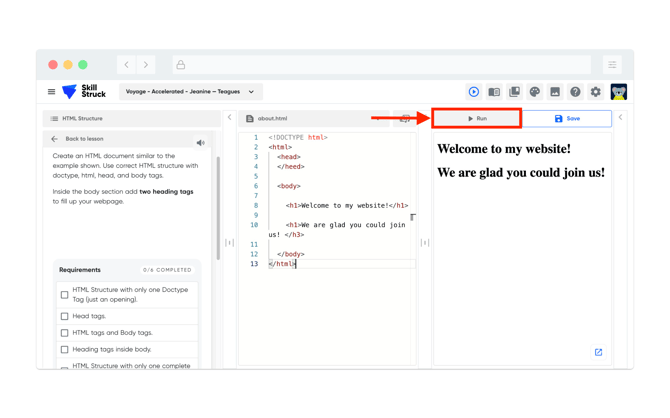
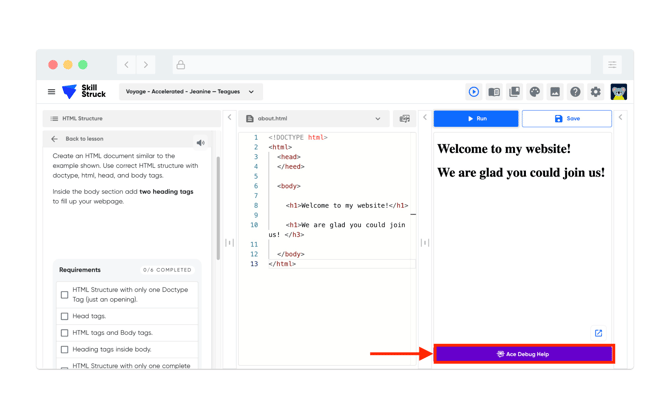
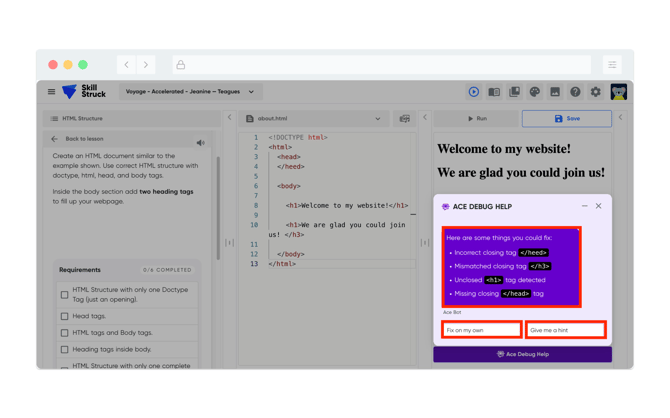
- After running their code, the Ace Debug Help button will appear in the bottom right of their screen, click on the button.
- From the Ace Debug Help pop-up, it will provide students with possible errors with their code. It will allow them to "Fix on my own" or to "Give me a hint".
- If the student clicks "Give me a hint" it will provide information for them to check. They will be prompted to chose either "Give me a hint" or "Show me where".
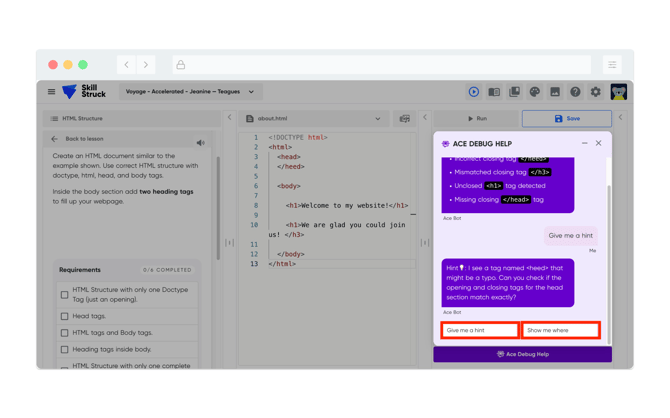
- If the student clicks "Show me where" the code with possible issues will be under-lined with red squiggly lines. They will be presented with "Give me a hint" or "Show code checklist".
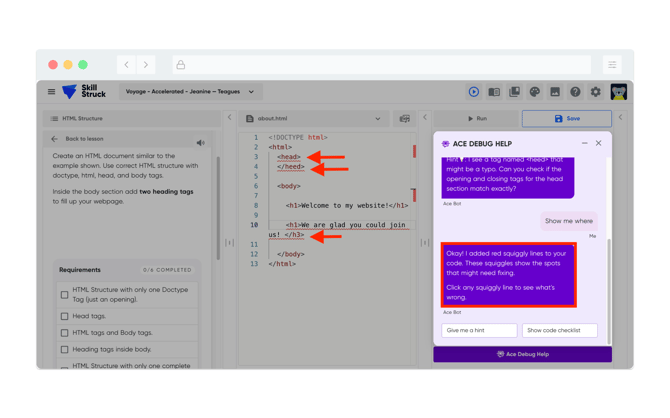
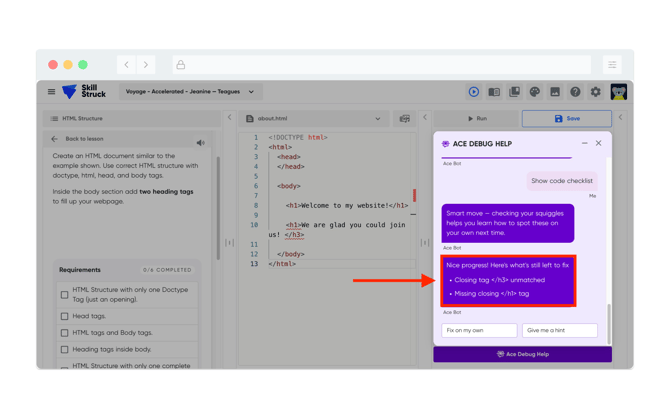
- After making updates. If they click "Show code checklist" the checklist will update.
- If the student needs additional help, they can click on one of the red squiggly lines and click on "Explain more".
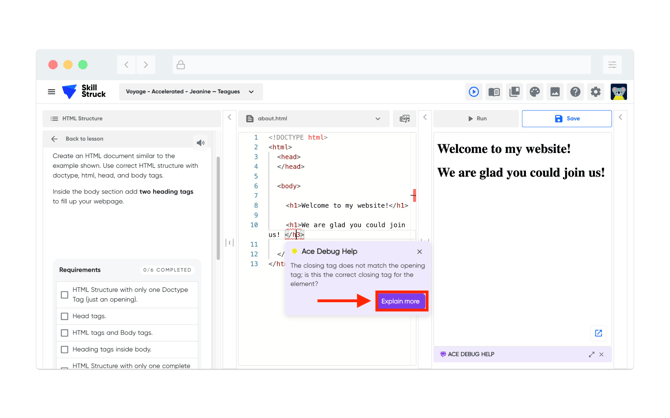
- After clicking "Explain more", it will provide additional information based on the squiggly lined code that they clicked on. It will also provide options specific to the code like: "Show code example", "Explain matching tags", "See tag structure rules", and "Show me where".
After five advanced interactions, Ace will temporarily pause for 10 minutes. Students can continue editing and running their code while they work toward a solution independently.
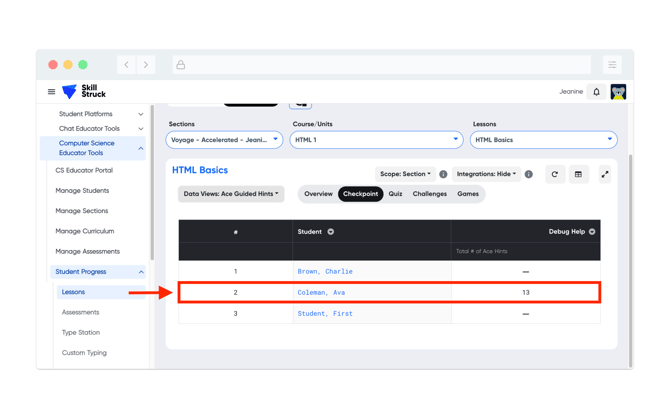
Viewing Ace Debugger amount of hints provided to student
-
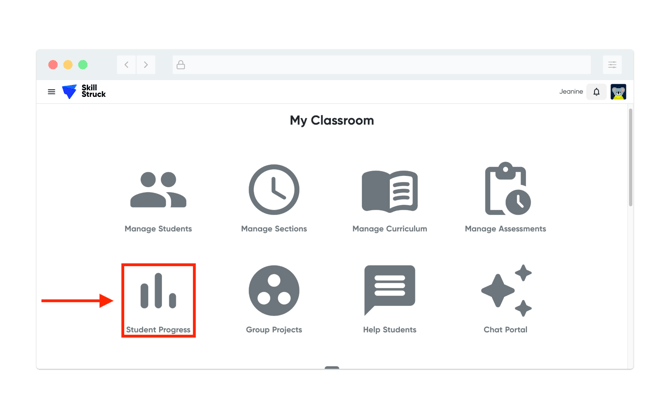
From the Educator Portal, select Student Progress.
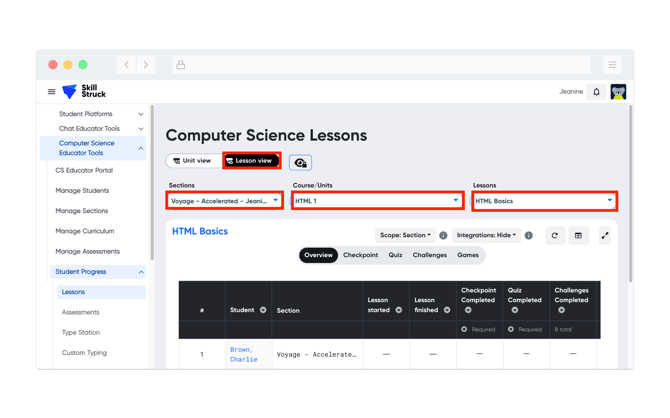
- From the Student Progress page toggle to Lesson view, select the correct Section, Course/Units, and Lesson.
- Select the Checkpoint tab.
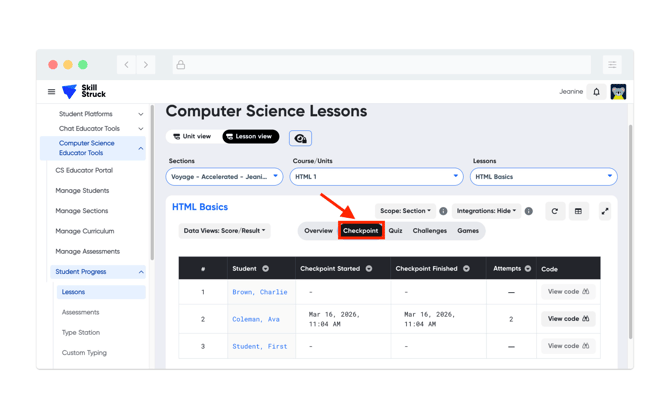
- From the Data Views drop down, select Ace Guided Hints.
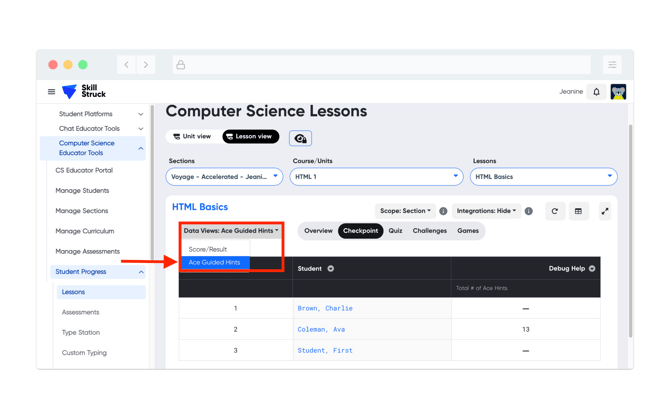
- You will now be able to see on a per student basis how many hints were used by the student.